
Cities across North America are grappling with a growing divide between wages and home prices, creating a housing market that many find “impossibly unaffordable.”
Current data shows that U.S. home prices have become less affordable than during the lead-up to the 2008 global financial crisis. This affordability crunch stems from a combination of high interest rates and skyrocketing home prices following the pandemic, although some regions have recently experienced a slowdown in growth.
A graphic from Visual Capitalist’s Dorothy Neufeld illustrates housing market affordability in North America, drawing on data from the Globe and Mail via Hanif Bayat.
The Housing Affordability Crunch in 2025
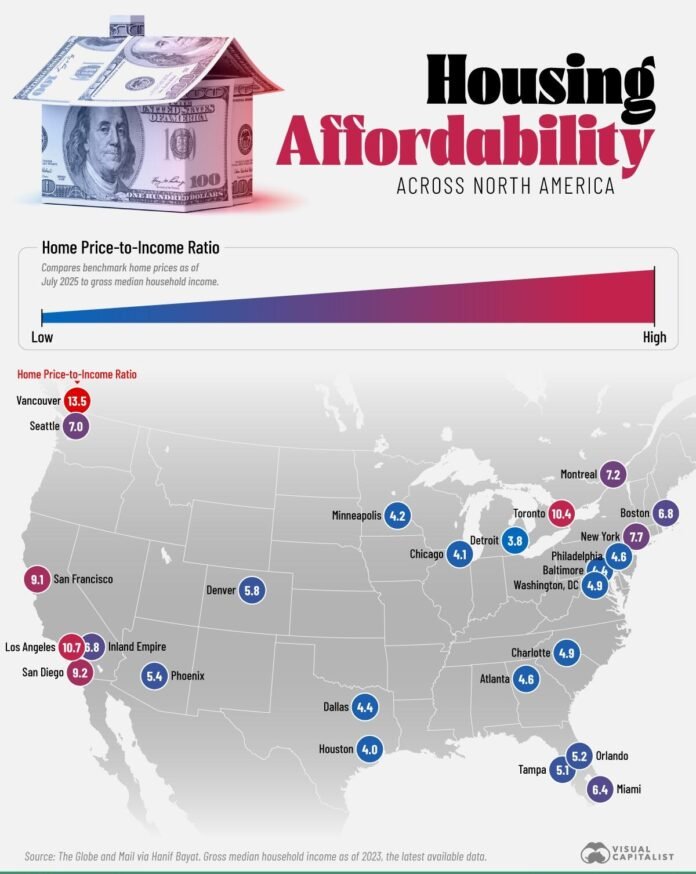
As of July 2025, benchmark home prices are compared to gross median household income in major metro areas across North America:
Gross median household income data is current as of 2023, the latest figures available.
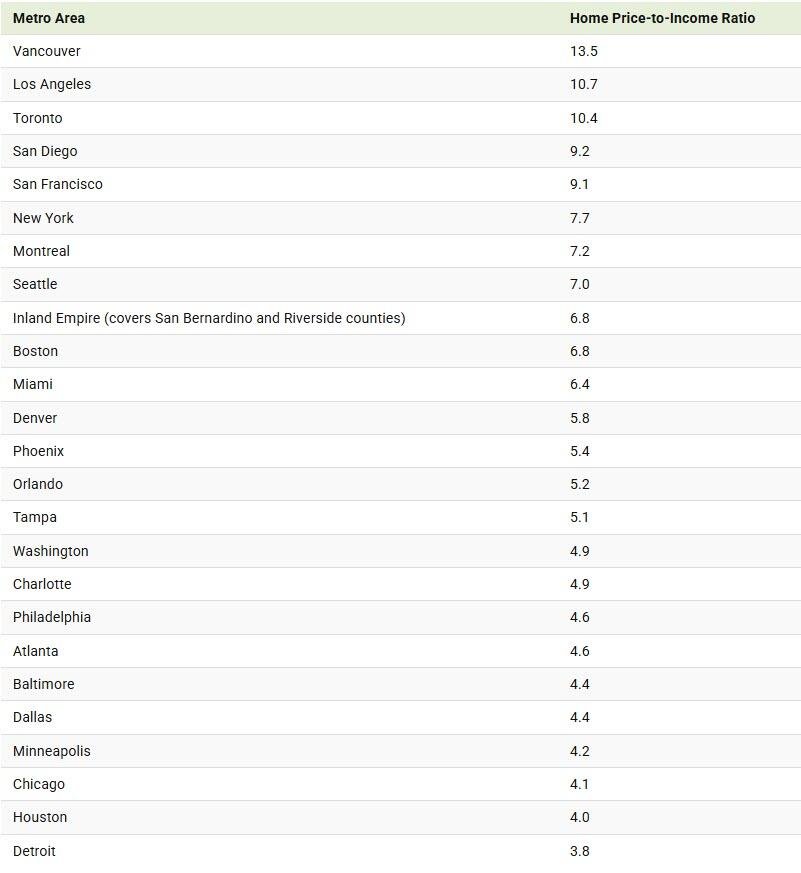
Vancouver, Canada, has an astonishing home price-to-income ratio of 13.5, making housing nearly unattainable for most residents. This ratio surpasses that of all major U.S. cities, where the average price for a detached home often exceeds $1.4 million—up from around $250,000 in 2000. In Toronto, home prices are over ten times the median household income.
On the U.S. West Coast, cities like Los Angeles, San Diego, and San Francisco rank as the most unaffordable due to high demand and limited supply, with San Francisco’s proximity to Silicon Valley exacerbating the issue.
In the middle of the affordability spectrum is Miami, where home prices stand at 6.4 times the median household income. Although prices have seen a slight decline over the past year, they have surged by 61% since July 2020, raising ongoing concerns about affordability.